Eia short term energy outlook что это

Forecast Highlights
Прогноз основные моменты
Global liquid fuels
Глобальное жидкое топливо
Спотовые цены на нефть марки Brent составляли в среднем $65 за баррель (б) в ноябре, что на $16 за баррель ниже по сравнению с октябрем — самое большое среднемесячное снижение цен с декабря 2014 года.
EIA ожидает, что спотовые цены на Brent составят в среднем $61 в 2019 году, а цены на сырую нефть West Texas Intermediate (WTI) в среднем будут примерно на $7 за баррель ниже цен на Brent в следующем году. Стоимость фьючерсных и опционных контрактов NYMEX WTI на поставку в марте 2019 года, которые торгуются в течение пятидневного периода, заканчивающегося 6 декабря 2018 года, предполагает диапазон $36/барр — $77/барр, Что соответствует ожиданиям рынка для цен WTI в марте на уровне достоверности 95%.
По оценкам EIA, добыча сырой нефти в США в ноябре составила в среднем 11,5 млн. баррелей в сутки (б/д), что на 150 000 б/д с октябрьских уровней из-за возобновления нормальной работы платформ после аварийных отключений, связанных с ураганом в октябре. EIA ожидает, что добыча сырой нефти в США в 2018 году составит в среднем 10,9 млн баррелей в сутки по сравнению с 9,4 млн баррелей в сутки в 2017 году и в среднем 12,1 млн баррелей в сутки в 2019 году.
EIA прогнозирует, что общие запасы нефтепродуктов в мире увеличатся примерно на 0,3 млн. баррелей в сутки в 2018 году и на 0,2 млн. баррелей в сутки в 2019 году. Прогнозируется, что мировое производствв нефтепродуктов увеличится на 1,4 млн. баррелей в сутки в 2019 году. EIA ожидает роста производства в Соединенные Штаты будут частично компенсированы снижением производства в других местах, особенно в Организации стран-экспортеров нефти (ОПЕК), где EIA прогнозирует, что производство жидкого топлива сократится на 0,9 млн баррелей в сутки в 2019 году. EIA ожидает, что глобальное потребление нефтепродуктов составит рост на 1,5 млн. баррелей в сутки в 2019 году, причем рост в основном будет происходить из Китая, США и Индии.
Natural Gas
Природный газ
Спотовая цена на природный газ Henry Hub в ноябре в среднем составляла $4,15/млн британских тепловых единиц (MMBtu), что на $0,87/MMBtu в среднем дороже по сравнению с октябрьским показателем. Холодные температуры и низкий уровень запасов способствовали росту цен. Несмотря на низкий уровень запасов, EIA ожидает, что сильный рост добычи природного газа в США окажет понижательное давление на цены в 2019 году. EIA ожидает, что спотовые цены на природный газ Henry Hub в среднем составят $3,11/MMBtu в 2019 году, что на $0,06 ниже среднего уровня 2018 года и ниже прогнозируемой средней цены $3,88/MMBtu в четвертом квартале 2018 года. Стоимость фьючерсных и опционных контрактов NYMEX на поставку в марте 2019 года, торгуемых в течение пятидневного периода, заканчивающегося 6 декабря 2018 года, предполагает диапазон от $1,85/MMBtu до $8,37/MMBtu. Уверенность ожидания рыночных мартовских цен на природный газ на Генри Хаб составляет 95%.
По оценкам EIA, запасы природного газа в США составляли 3,0 триллиона кубических футов (Tcf) на конец ноября, что было на 19% ниже пятилетнего (2013–17) среднего значения на конец ноября.
EIA прогнозирует, что добыча сухого природного газа в среднем составит 83,3 млрд куб. футов в день (Bcf/d) в 2018 году, что на 8,5 млрд куб. футов/ день в 2017 году. Как уровень, так и объем роста добычи природного газа в 2018 году установят новые рекорды. EIA ожидает, что добыча природного газа продолжит расти в 2019 году в среднем до 90,0 млрд. куб. футов в сутки.
Electricity, coal, renewables, and emissions
Электричество, уголь, возобновляемые источники энергии и выбросы
EIA ожидает, что доля США общей генерации полезности масштаба электроэнергии из природного газа тепловых электростанций возрастет с 32% в 2017 году до 35% в 2018 году и в 2019 году EIA прогнозирует, что доля производства электроэнергии из угля в среднем на 28% в 2018 году и 26% в 2019 году, по сравнению с 30% в 2017 году доля атомной генерации составила 20% в 2017 году и EIA прогнозирует, что она будет в среднем около 19% в 2018 году, а в 2019 году Ветер, солнечная и другие nonhydropower возобновляемых источников энергии при условии, около 10 % выработки электроэнергии в 2017 году EIA ожидает, что они обеспечивают 10% в 2018 году и 11% в 2019 г. доля производство гидроэлектроэнергии было 7% в 2017 году, и EIA прогнозирует, что это будет примерно то же самое в 2018 году и в 2019 году.
EIA ожидает, что в среднем США солнечной генерации увеличится с 212000 мегаватт часов в день (МВт · ч / г) в 2017 году до 268000 МВт · ч / г в 2018 году (увеличение на 27%) и 303,000 МВт · ч / г в 2019 году (увеличение на 13%), В последние годы в промышленности наблюдается переход от фиксированного наклона систем солнечных фотоэлектрических систем для отслеживания., Хотя системы слежения являются более дорогими по сравнению с системами фиксированной наклона, доход от дополнительной электроэнергии, следуя по пути солнца по небу часто превышает увеличение стоимости.
Экспорт угля из США за первые девять месяцев 2018 года составил 87 миллионов коротких тонн (MmSt) по сравнению с 69 MmSt, экспортированных за тот же период в 2017 году. В июле и сентябре 2018 года экспорт энергетического угля (использованного для производства электроэнергии) превышал экспорт металлургического угля (используется для производства стали). До июля 2018 года последний месяц, когда это происходило, было в феврале 2015 года. EIA ожидает, что экспорт угля составит 113 MMst в 2018 году и 102 MMst в 2019 году. EIA ожидает, что добыча угля в США составит 762 MMst в 2018 году (на 2% меньше, чем в 2017 году), и 742 MMst в 2019 году (снижение на 3% по сравнению с 2018 годом).
После снижения на 0,8% в 2017 году, EIA прогнозирует, что США связанных с энергетикой выбросов двуокиси углерода (СО2) будет расти на 3,0% в 2018 году Это увеличение в значительной степени отражает потребление более природного газа в 2018 году для нагревания во время более холодной зимы и для электрического поколения к поддерживать больше охлаждения в течение более теплого лета, чем в 2017 году EIA ожидает, что выбросы снизятся на 1,2% в 2019 году, поскольку он прогнозирует, что температура вернется к почти нормальным. Энергетические выбросы CO2 чувствительны к изменениям погоды, экономического роста, цен на энергоносители, а также топливной смеси.
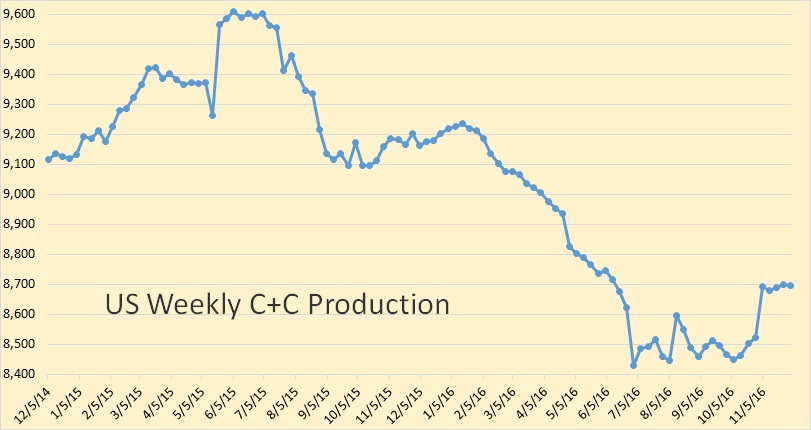
All US production is Crude + Condensate. All other production numbers are total liquids. The data is in million barrels per day.

The EIA has US production leveling out at just under 8.8 million bpd until Oct. 2017.
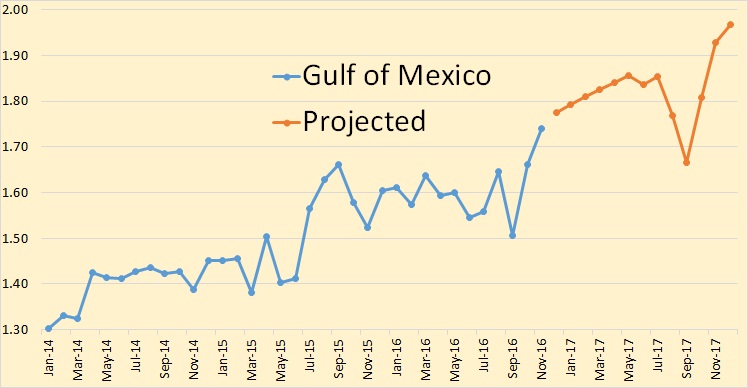
They have all large gains coming from the Gulf of Mexico.
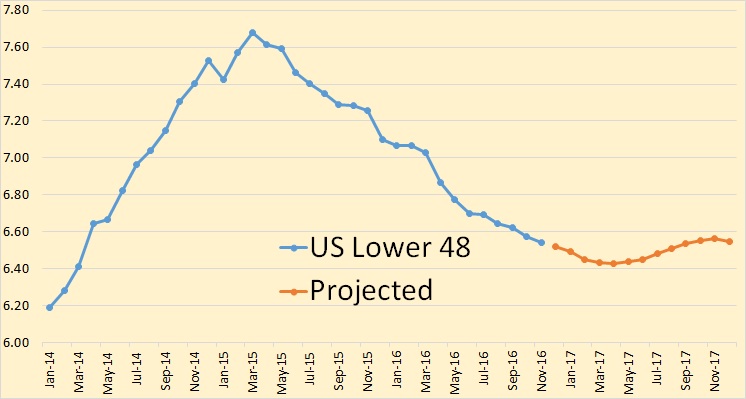
The EIA sees no big gains coming from shale plays. They have production bottoming out in March and April, then increasing only slightly the rest of the year.
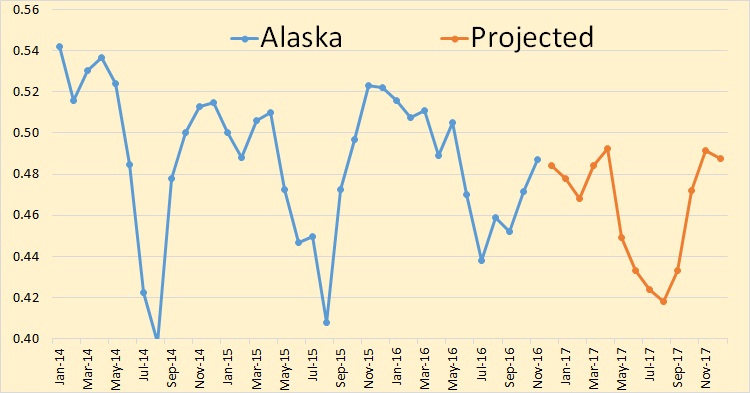
They have Alaska pretty much holding its own thru 2017.
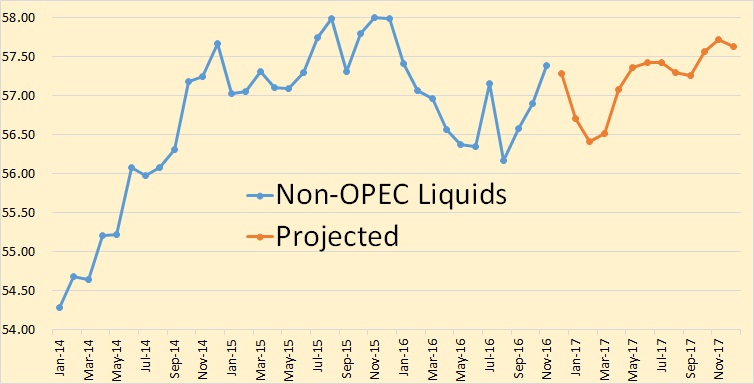
They have Non-OPEC liquids recovering in 2017 but still holding below the 2015 average.
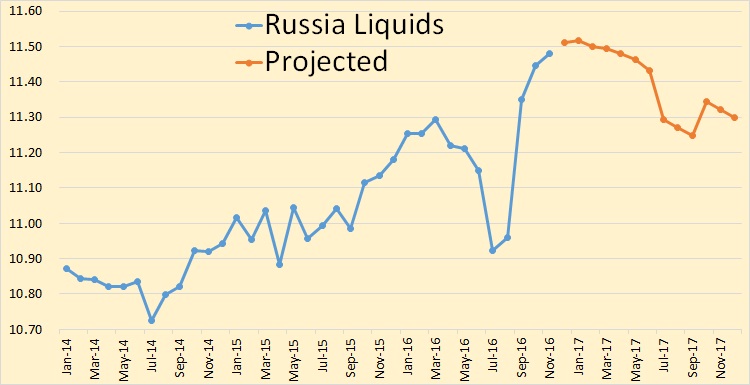
The big increase in 2017 average is supposed to come from Russia. They have Russia peaking in January then starting a slow but steady decline.
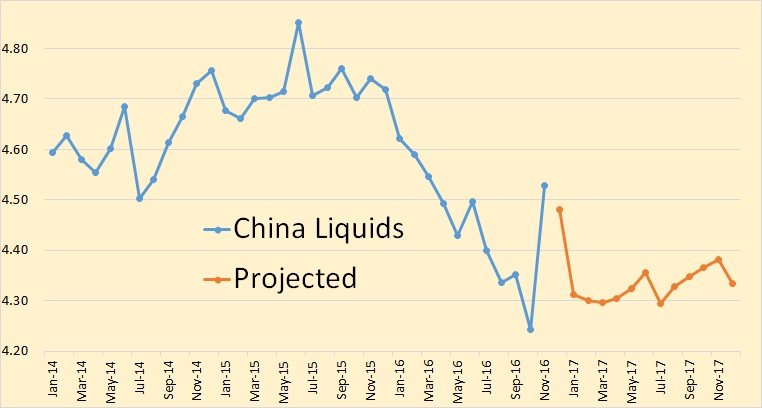
The EIA says China saw a huge increase in liquids production in November, down slightly in December before dropping again in January. I have no idea where the EIA got this November production data from. I could find nothing on the web that confirmed this data.
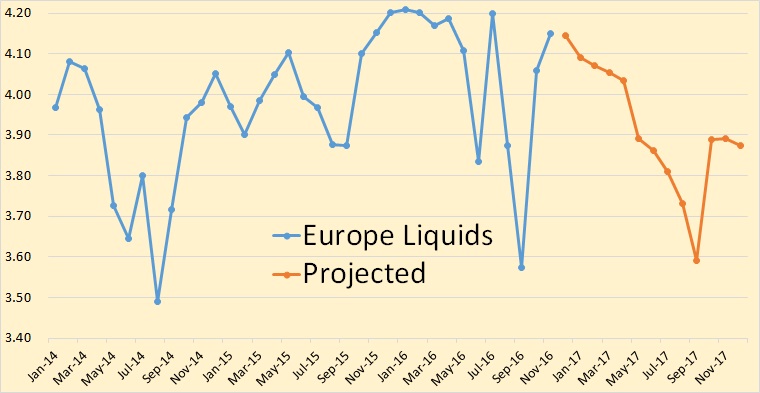
Europe consist primarily of the UK, Norway and other North Sea production. The EIA has Europe declining throughout 2017 before recovering somewhat in October.
Ron Patterson
228 thoughts to “EIA’s Short-Term Energy Outlook”
Ron and/or Dennis.
Hi Shallow sand,
Steve at SRS Rocco report has a new, very informative post up showing that Middle East oil exports are lower today than 40 years ago!
Would be great to see an update on the global export land model that Jeff Brown (westexas) used to update us on. How much C+C is available on the global markets as of today after domestic consumption?
I´m not Jeff B. but if I remember last version of BP stats. correctly, the net export market has been on a bumpy plateau between 2005-2015. It has varied between 41-44 Mb/day (approx.). 2015 set a record which was just slightly higher than 2005. It´s possible that 2016 will be slightly higher.
I like this link.
World exports have been bumpy flat for 10 years or so.
I like this site as I take an interest in observing the changes as exporters become importers. The country charts provide some rough idea of those timings.
interesting link, I think you misread the Ecuador graph though
2015 was indeed a net export record. The increase came mainly from Canada, Iraq and Russia. Iran may boost net exports in 2016, Kazakhstan will also add some. At least to me it seems unlikely that net-exports will grow substantially above the 2015/16-level. Increase from the mentioned countries will be needed to compensate decline in Mexico, Colombia, etc (+problems in Venezuela). Seems more likely it will continue on the plateau or decline. Nigeria and Libya are wildcards.
mazamascience also use BP-data but seems to give a much higher number,
How do you calculate world total net export numbers if total global exports = total global imports?
Meanwhile, BP statistics for world oil exports (not net exports) show a rising trend.
I expect further increase in 2016, due to rising exports from Saudi Arabia, Iran, Iraq and Russia.

Iraqi oil production and exports in 2016 were also above 2015 levels
source: IEA OMR, November 2016

So that says KSA domestic consumption is 2ish mbpd?
Are we comfortable with that?
9 subtracted from 10.5. Leaves 1.5 consumption.
This looks bogus.
Did email BP. Waiting.
10.5 is crude only.
Total liquids (including condensate and NGLs) was 12.0 mb/d in 2015 (BP number)
Compared with your figure, US, for example, is thus not included, Canada has a lower value (import light), etc.
I second the motion. JJB where are you!? I love your net export comments.
Jeffrey Brown posts (as Jeffrey Brown) at OilPro.
Thanks for that piece of info.
BP’s numbers for oil exports (available from 1980) and production less consumption (available from 1965) are slightly different, which may reflect changes in inventories and other balancing items.
According to BP, Middle East oil exports in 2015 was 20.6 mb/d, the record for the period from 1980.
Production less consumption was 20.5 mb/d vs. all-time high of 20.8 mb/d in 1976-1977.
But 2016 should see a new record due to ramp-up in production and exports from Saudi Arabia, Iran and Iraq.
Middle East oil exports (mb/d)
Source: BP Statistical Review of World Energy

Iran exported condensate around the sanctions. This was called oil. Probably still do.
Iran sold 600,000 bpd of condensates for September, including about 100,000 bpd shipped from storage, to meet robust demand in Asia, the two sources said. September crude exports increased slightly from the previous month to about 2.2 million bpd, they said.”
How does one respond to people who reject fundamental mathematical principles? More importantly perhaps, why should one waste one’s time responding to people who reject fundamental mathematical principles?
The thread(s) surrounding the post-in-question is(/are) interesting as well.
I have not read through their entirety but am curious to know if and/or how it was resolved.
Jeffrey does not like the way Enno Peters and I do mathematics, I guess. That is his problem, Enno does a great job, I occasionally make mistakes, but if Jeffrey Brown needs yes men he should look elsewhere and he has.
Fair enough, Dennis.
I, along with others apparently, was simply previously unaware as to why Jeffrey might have left, and exactly when and so decided to look into it.
As we have a little in the way of hindsight, does it remain your contention that we have passed peak production, as I recall, in 2015? And/or has any particular circumstance either confirmed your view then (e.g., the dearth of capex in exploration), or has given you reason to think that global production may continue to increase?
I still think 2015 will be the peak. 2016 is already in the books at slightly below 2015 production levels. No doubt that Non-OPEC 2017 levels will be below 2015 but OPEC production will make it close. But I am still betting on 2015. After that serious depletion starts to set in. So we are currently on that bumpy plateau but that bumpy will last 5 years or less, not the couple of decades it was supposed to last.
Do you have any predictions or wild ass guesses on the slope of the production decline or perhaps where world crude plus condensate production might be by 2020 and/or 2025?
Not really. We all had a pretty good idea where things were heading until shale oil raised its ugly head. No one that I know of predicted that. But now it looks like shale oil is a USA phenomenon with no appreciable production anywhere else in the world.
My strong feeling right now is that the shale oil phenomenon has given the entire world the idea that peak oil is, or was, an illusion or an idea that had no valid support in the real world.
But peak oil is as real as it ever was. The amount of recoverable oil in the ground is finite. We may have had the numbers wrong in our personifications because of shale oil. But that does not change the big picture. The peak oil phenomenon is as real as it ever was.
The real danger is that the media, as well as the general public, has been sold the idea that peak oil has now been discredited because of shale oil. It has not. And that only increases the dramatic shock effect it will have when it finally becomes obvious that peak oil has arrived.
2016 10K will be out in late February-early March for US LTO producers.
It will be interesting to compare 2014, 2015 and 2016. In particular I am waiting to see the estimates of future cash flows to see how much more the engineering firms let them slash future estimated production costs and estimated future development costs.
In my opinion, there was a lot of hocus pocus in those particular numbers, which, of course provide the basis for proved reserves and PV10.
To me, that is like a farmer saying I estimate next year and beyond that the cost of seed, chemicals, fertilizer, fuel, labor, real estate taxes, etc, will fall by 60%. I am not familiar with any commodity based business where that is reality. Yet almost ALL US LTO did the same thing, 30-60% reduction.
The point is, had they not done that, they would have basically lost ALL of their proved reserves at 2015 prices. My point is, how can a company that is losing large amounts, pre-reserve write downs, have any economic reserves? If the costs cannot all be recovered for the well at SEC prices, there are no reserves for that well.
2016 SEC prices are about $10 lower. We shall see what they come up with.
I think the odds are pretty good that Ron is right. We can hope that Dennis C and the others who think production will stay on a plateau for a while and then gradually decline rather slowly are right.
If they are, and the electric car industry does as well as hoped, then the economy national and world wide can probably adapt fast enough to avoid catastrophic economic depression brought on specifically by scarce and expensive oil.
If for some reason, any reason, oil production declines sharply and suddenly, for a long period or permanently, we are going to be in a world of hurt.
People need not starve, at least in richer and economically advanced countries, but millions of people could lose their jobs and a lot of businesses dependent on cheap travel would fail. The effects of these lost jobs would expand outward thru the economy doing Sky Daddy alone knows how much damage.
In poor countries, starvation is a real possibility.
What Ron Patterson and the Peak Oil-ers in general fail to include in their calculations is the geopolitical aspect of oil, as well as Global Economics.
This is the point I have been periodically making on this blog but nobody seems to be picking up on it. Yes, countries such as the US, Norway, UK, Indonesia etc have peaked to various degrees and can only maintain or increase production temporarily via massive capital expenditure and technological breakthroughs. While countries that have been victims of US-EU (NATO) hostility are merely trying to navigate out of the siege laid against them until they hold enough leverage to produce closer to their real potential.
For the US, the aim of oil production is to be maximized, so that imports can be minimized and also that oil exporters (such as Russia) can enjoy far less strategic or economic leverage.
Baloney! The US government does not have an aim of oil production. The US government does not produce a single barrel of oil. Oil, in the USA, is produced by private and publicly owned companies. Their aim is to make money, nothing else.
Hence, the expensive and risky gambit on shale oil and tar sands in North America.
The US sanctions against Russia was because of their takeover of Crimea and their invasion into Ukraine. It had nothing to do with trying to suppress their oil production. Ditto for the Iranian sanctions. Obama wanted to halt their development of nuclear weapons. Good God man, do you really believe those sanctions was about suppressing their oil production instead?
So, for the umpteenth time, Russia, Iran, Iraq, Kazakhstan and very possibly Libya and Venezuela are nowhere near the peaks and will be growing producers in the coming decades.
Libya and Venezuela peaked long ago. Russia is at her peak right now. Iran is very likely post peak. Iraq can increase production slightly but is very near her peak. Kazakhstan is at 1.75 million bpd and if they can manage to keep the toxic oil from Kashagan from corroding their pipes they may one day get to 2 million bpd. Big deal.
So, I hope that your blog is still around in the coming years, when all of Russia, Iran, Iraq, Libya, Venezuela & Kazakhstan boost oil production. Some of them will boost their production massively, others significantly. You will see.
What about Saudi Arabia sponsoring terrorists all around the world? Is it a perfect modern democracy?
Especially in matters of hypercomplexity (and vested interests, etc.).
Plateau until 2019 or 2020 then some decline slow at first and gradually accelerating. Unless a recession hits in that case acceleration is more rapid.
Thanks Dennis, on the rare occasion where we agree. 😉
I also agree peak oil will be obvious before long, I think eventually (by 2020 at least unless a big recession intervenes) oil prices will rise, maybe to $100/b. Most will expect a big surge in output, but any surge will be small (1 Mb/d at most) and likely short lived (if it happens at all).
Whether oil prices spike and this leads to either Great Depression(GD) 2 or a lot of EV and plugin sales is unknown, it might be the latter at first with GD2 following between 2025 and 2030. It will depend on how quickly oil output falls, I think it might be 1% or less until 2030 if oil prices are high with faster decline rates once the depression hits.
As usual big WAGs by me. Of course nobody knows, but your insights on how things might play out would be interesting.
For some insane reason, the major oil companies are hell-bent on exploration and production, even when oil prices are so low that OPEC & non-OPEC companies are coordinating to reduce output.
That exploration and production is going to be largely unsuccessful and entirely unprofitable.
A lot of what is reported here is info that the industry knows, even if the public at large and politicians do not.
In a nutshell, the fossil fuel question boils down to depletion and the environment. What are we going to do about these two problems, which are very different, but nevertheless very much the same, since they are so tightly intertwined?
I used to be a fossil fuel doomer, but over the last few years I have grown cautiously optimistic that we CAN ( at least from the technical pov ) transition to renewable energy while still maintaining an industrial civilization and the good life associated with it.The mind blowing progress made in renewable energy led me to change my mind.
The potentially killer question is this one. WILL we finish the transition before we run short enough of fossil fuels that finishing it is impossible? (Or before we muck up the environment so bad we wish we HAD run out of fossil fuels sooner? )
It is POSSIBLE- possible , mind you, dear reader, that we really are at risk of a sudden and economically catastrophic shark fin decline in oil production, and maybe in the production of natural gas as well. Maybe even coal, but I personally think there is coal enough to last until the renewables industries are ready to shoulder the load.
And IF this is the case, then whatever the Trumpsters might do to prop up the fossil fuel industries a few more years will be that many more years we have to make technical progress in renewables.
Breakneck technical progress will continue to be made, overseas if not domestically. We can easily import technology. The renewables industrial base will continue to grow rapidly world wide.
I think maybe that every time we double the amount of renewable energy that is produced, we may be halving the potential difficulties involved in doubling it again. And beyond that, every ton of coal we save, every cubic meter of gas we save, every barrel of oil we save, in the event that a supply crisis DOES happen, means we have those tons and cubic meters and barrels to put to CRITICAL uses.
This military analogy might be a poor one to get my point across, but many a general has left a rear guard to allow him to move the bulk of his army to a safer place. Sometimes the guard left has been to small, sometimes it was adequate. A thousand men out of fifty thousand might not be enough, but two thousand might do the trick. An additional five or ten percent of our total energy consumption coming from renewables, combined with efficiency and austerity measures, MIGHT be the difference between a successful transition and a crash that means the end of life as we know it.
Four more years of abundant fossil fuel energy might just be THE DIFFERENCE.
I am not arguing that this scenario is the case, but that it is POSSIBLE that it might be the case.
Preacher sez God works his miracles in mysterious ways. Maybe Sky Daddy sent us the Trumpsters to give another four years of cheap fossil fuels so we can continue to work on renewable tech in the meantime. 😉
Читайте также:


